Probability is practical math that is interesting and useful at the same time. It is easy for youth to engage in fairly complex exercises in probability because it speaks to them. This lesson explores some fundamentals of probability and its application in the "real" world. For an interesting take on why this type of mathematics is so important, watch Arthur Benjamin’s short talk What Math Students Should be Learning.
Whether you know it or not, you are a fortune teller of sorts. Every day, all day, you are constantly predicting what will happen:
We can actually measure how likely it is for something to happen, and that measurement is called probability.
Let’s start with dice. Take a die (make sure it’s fair, not weighted or "funny" in any way). What are the odds (the probability) of rolling a 3 if you roll the die one time? Hopefully you figured out that it is one in six because there are six sides to the die, and one of those sides has three dots.
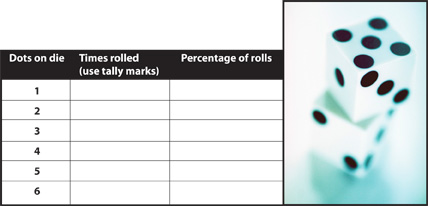
Let’s try it. Take the die and roll it 100 times, recording your results. Calculate the percentage of each result (for example, if you rolled a 2 17 times, that would be 17/100, or 17 percent).
We would expect that the percentages for each number would hover around 16 or 17, which is 1/6 or .1666. This is probability in a nutshell.
Now guess what the percentage would be if you added up the percentages of the rolls of only the odd-numbered sides. When you add up those roles, does the percentage come close to your guess?
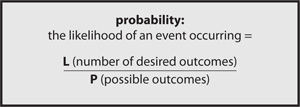
Probability is the ratio of the times an event is likely to occur divided by the total possible events. In the case of our die, there are six possible events, and there is one likely event for each number with each roll, or 1/6.
If there were no dots on any of the sides, the probability of rolling a 3 would be zero because there would be no 3 and no other dots either, giving us this ratio: 0/0. If every side had three dots, the probability of rolling a 3 would be 1 because it would be 6/6, or 1. So, probability is expressed as a number somewhere between 0 (not gonna happen) and 1 (definitely going to happen), with ratios closer to 1 being most likely.
Let’s put it in formula form:

So far, we’ve just looked at things that could occur. What about looking at things that have actually happened? We call that relative frequency, and it has its own formula:
Think back to your die experiment above. The first formula gives you your expectation (1/6). The formula for relative frequency gives you the actual outcome. What was the relative frequency of rolling 5s in your die-rolling experiment?
The more times we roll the die, the closer we will get to the outcome we expected (1/6). We call that the Law of Large Numbers — even if you don’t get it to come out like you expect with a few tries, the more you do it, the closer you will come to the expectation.
Flip a penny 10 times and record how many times it lands on heads and how many times it lands on tails. Now flip it 100 times and record your results.
Did you get closer to a ½ ratio the second time? That’s the Law of Large Numbers at work. Remember, the Law of Large Numbers tells us that the more times you repeat an experiment, the closer the relative frequency will come to the probability.
We have one more thing to learn before we move on. Let’s figure out how to calculate the possible outcomes of an event. We’ve figured out the probability of simple events occurring, but what happens when the possible outcomes are harder to figure out?
When you are rolling one die or flipping one coin, it’s simple to figure out possible outcomes, but it gets more complicated when you add in more dice or more coins.
Imagine that your parents pay you an allowance of 50¢ a week (they’re so stingy!). Let’s say you love nickels. What is the probability that your 50¢ will contain a nickel? We need to figure out all the possible ways to give someone 50¢.
Let’s say that your parents don’t ever use pennies or 50-cent pieces. Besides those, there are three possible coins to use: nickels, dimes and quarters. If your parents pay you in quarters, it’s simple, right? Two quarters make 50¢. But what other possible combinations make 50¢? And how likely are you to get that nickel you want?
| Quarters 25¢ |
Dimes 10¢ |
Nickles 5¢ |
|
| 1 | 2 | 0 | 0 |
| 2 | 1 | 2 | 1 |
| 3 | 1 | 1 | 3 |
| 4 | 1 | 0 | 5 |
| 5 | 0 | 5 | 0 |
| 6 | 0 | 4 | 2 |
| 7 | 0 | 3 | 4 |
| 8 | 0 | 2 | 6 |
| 9 | 0 | 1 | 8 |
| 10 | 0 | 0 | 10 |
Let’s set it up in the table below. First, across the top we’ll list the possible coins. Next, we’ll start listing possible combinations by listing the greatest possible number of that type of coin and then decreasing that by one on the next line. Once we’ve gotten to zero of that coin, let’s move to the highest level possible of the next highest coin. Sound confusing? It’s not once you get going. Let’s try it:
First, quarters. We list two quarters, and that makes 50¢ by itself, so the columns for dimes and nickels are zero. There are no other possible combinations with two quarters, so the next line lists one quarter. Remember, we are going from largest to smallest, so first we’ll try one quarter and the greatest number of dimes possible, which is two. There are two other possibilities with one quarter, so we’ll list those on the next lines and then the next lower number of dimes, which is one. That means we’ll need three nickels because we’ve always got to add up to fifty cents.
Now we’re out of possibilities that use quarters, so we move on to dimes. The most dimes we could have is five, so we start with that. We decrease that number by one on each line. For every dime we take away, we have to add two nickels, so notice that the nickels increase by two each line. We end up with 10 possible combinations of coins.
So, how many of the 10 possibilities contain nickels? Did you count eight? You’re right! So let’s put this in our probability formula:
8 = desired (or likely) outcomes/ 10 = possible outcomes
Does that seem like good odds to you? Not bad! What are the odds if you want a quarter? How many possibilities contained a quarter? Did you find four? So the odds of getting a quarter are:
4 = likely outcomes/ 10 = possible outcomes
Are you more likely to get a quarter or a nickel? All other things being equal (meaning your parents have a wide variety of coins and aren’t out of dimes or something), you are far more likely to get a nickel than a quarter.
Now’s your chance to do some more experiments with probability using what you have learned.
| $10 Bills | $5 Bills | $1 Bills | |
| 1 | 2 | 0 | 0 |
| 2 | 1 | 2 | 0 |
| 3 | 1 | 1 | 5 |
| 4 | 1 | 0 | 10 |
| 5 | 0 | 4 | 0 |
| 6 | 0 | 3 | 5 |
| 7 | 0 | 2 | 10 |
| 8 | 0 | 1 | 15 |
| 9 | 0 | 0 | 15 |
This series of lessons was designed to meet the needs of gifted children for extension beyond the standard curriculum with the greatest ease of use for the educator. The lessons may be given to the students for individual self-guided work, or they may be taught in a classroom or a home-school setting. Assessment strategies and rubrics are included at the end of each section. The rubrics often include a column for "scholar points," which are invitations for students to extend their efforts beyond that which is required, incorporating creativity or higher level technical skills.